
New: Interactive Historical Data Charts
Get to the bottom of web accessibility changes on your site using historical charts. Previously, our trend charts in the Automated Scanning History page let you know changes occurred on your site. However, they did not make it easy to determine what contributed to those changes. That was until our new interactive trend charts.
Now, our interactive charts let you:
- Select a data point on the chart and
- View any new, updated, or resolved violations and recommendations since the previous data point.
This feature will help you pinpoint what’s affecting your score and what you should tackle next. Adding this to your workflow helps visualize the impact of changes on your site — whether it be fixing a violation or adding a new component.
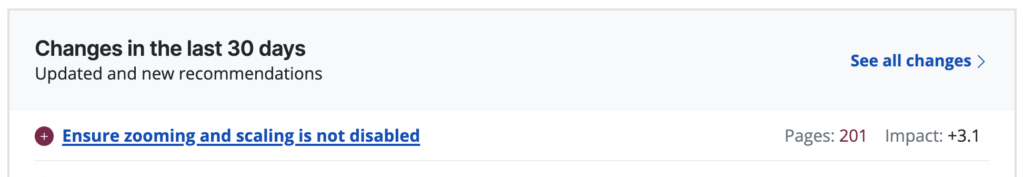
Access these charts by clicking the “See all changes” link in the “Changes in the last 30 Days” section of the website overview tab.
Don’t miss out on this feature. Log into RAMP, Create an account, or get in touch to learn more.
We have more exciting features coming your way soon. Until then, we’re excited to hear your feedback! Please don’t hesitate to send your thoughts and suggestions through our feedback form. As always, our support team is happy and available to help answer any questions or troubleshoot.