One Click Accessibility Reports
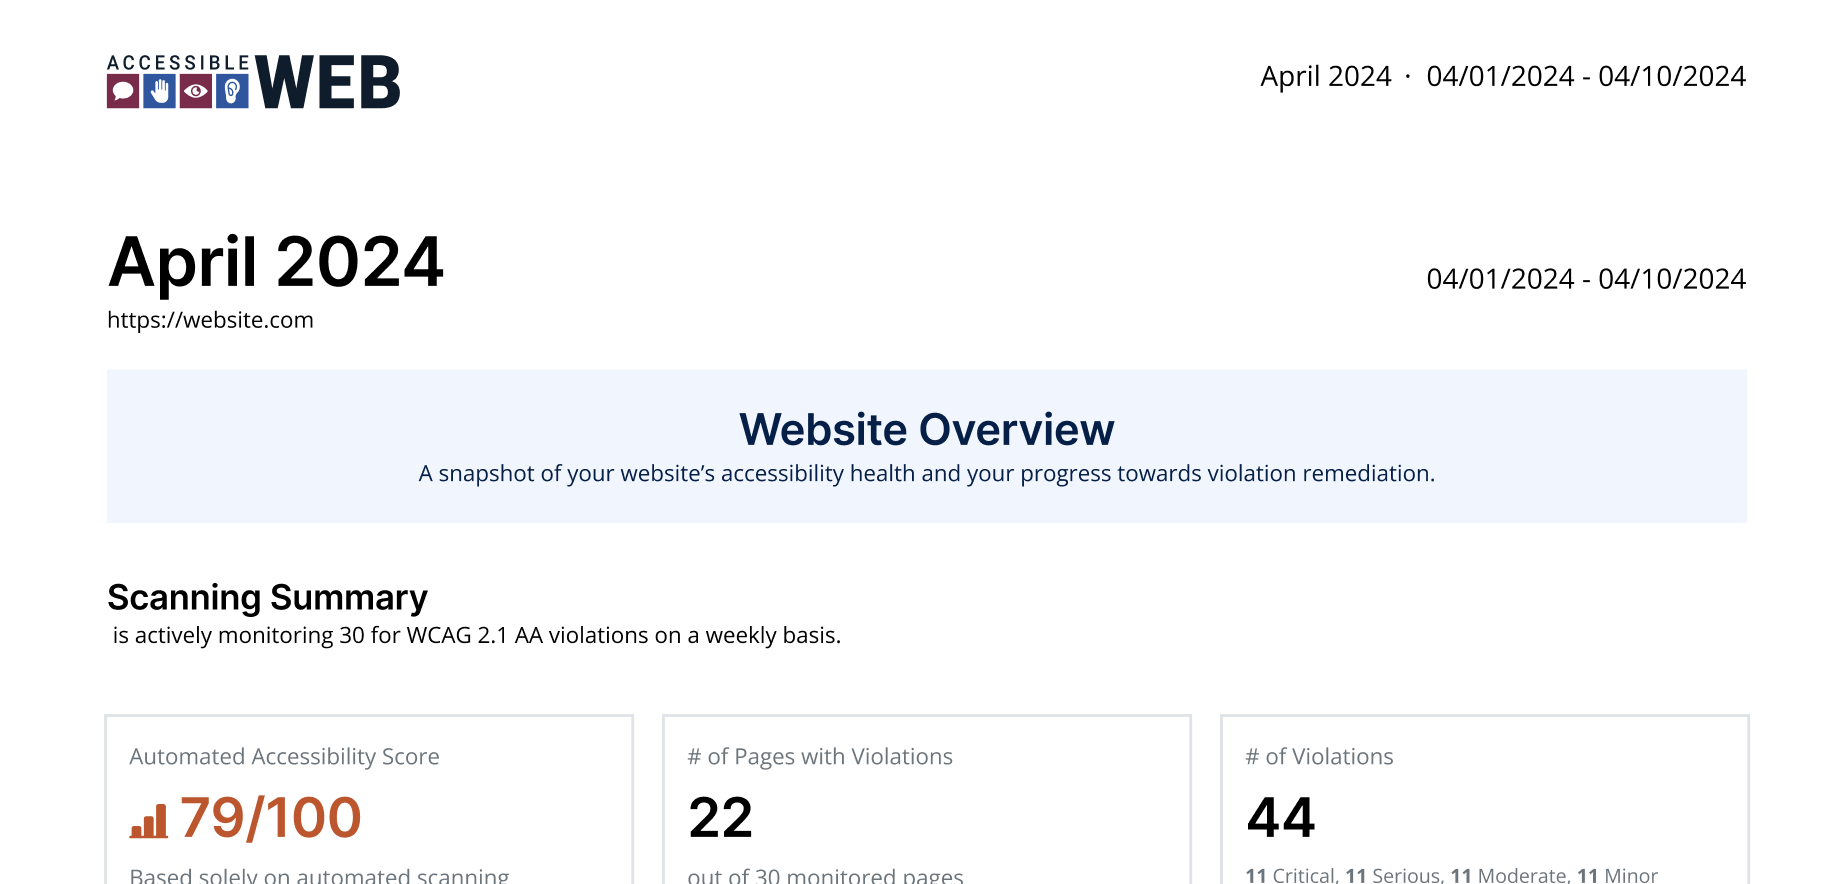
Accessible Web’s automated accessibility reports make it simple to get a snapshot of your website’s accessibility progress. Analyze trends and measure progress by quickly exporting an accessibility report with one click. Select the timeframe you want to overview and download the report, or revisit it at a later time.
Track Progress and Plan Ahead
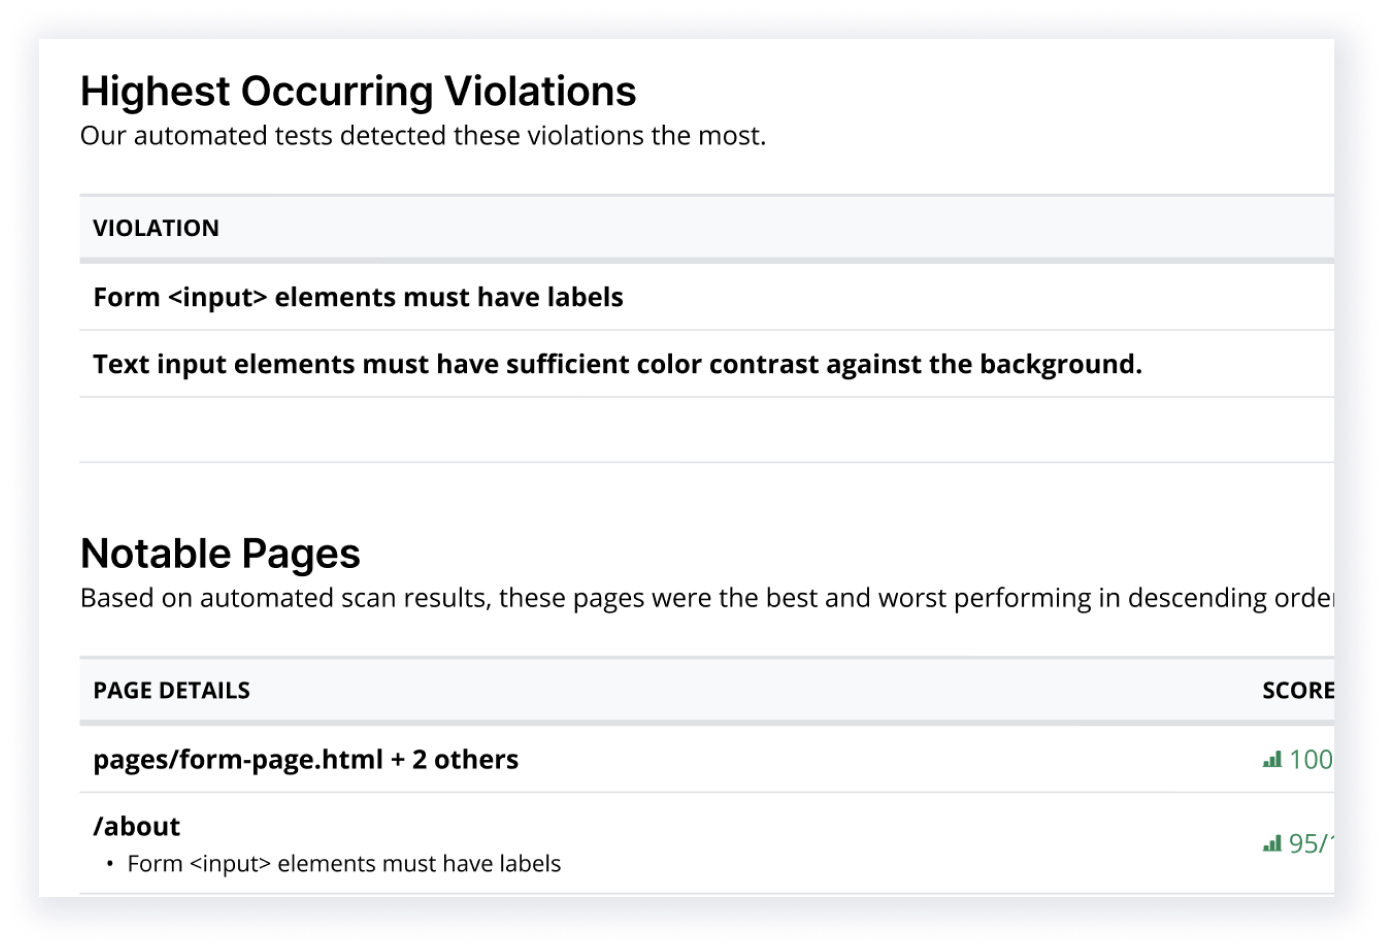
We provide essential metrics, such as your automated score, total violations, and the status of remediation tasks. Get granular with our breakdown of violations by type, or keep it simple with the automated scanning summary.
Site Level Reporting
This feature is available on RAMP Advanced, Pro, and Pro+ plans only.
Hear directly from our customers

“RAMP not only provides us with a list of remediations but is also a source of truth, tooling and automation on our journey to accessibility certification.”
— Anonymous user, Fintech Industry
“[RAMP] catches many accessibility issues in an automatic, recurring method, and gives great advice on how to correct it.”
— Deneb P, Developer
“Being provided with the troublesome code, suggested remediation and the ability to rescan individual pages to confirm successful remediation has been huge.”
— Joshua B, Developer
Ready to Get Your Site-Wide Accessibility Report? Try RAMP for Free
Sign up for a free 14-day trial of RAMP and start discovering web accessibility issues on your website within minutes.
(14-day free trial – no credit card required)